REPORT DIGEST

Program and Management
Audit of

Illinois Mathematics and Science Academy

Released: November, 1999

State of Illinois
Office of the Auditor General

WILLIAM G. HOLLAND
AUDITOR GENERAL

To obtain a copy of the report contact:

Office of the Auditor General
Attn: Records Manager
Iles Park Plaza
740 East Ash Street
Springfield, IL 62703
(217) 782-6046 or
TDD: (217) 524-4646

This Report Digest is also available on the worldwide web at:
http://www.state.il.us/auditor

SYNOPSIS

Legislative Audit Commission Resolution Number 115 directed the Auditor General’s Office to conduct an audit of the Illinois Mathematics and Science Academy’s admissions process. Our audit found the following:

  • State law requires IMSA to establish eligibility criteria which ensures "adequate geographic, sexual and ethnic representation." An IMSA official stated the ultimate goal of the selection process is to have admissions which approximate the demographics of the State. However, IMSA’s admissions policy directs that admissions reflect the diversity of the applicant pool. IMSA’s applicant pool, mainly in the area of ethnicity, is not representative of statewide demographics.
  • One result of IMSA’s attempt to comply with its statutory requirement to admit a class with adequate demographic representation is that applicants with lower total composite scores are admitted to IMSA over applicants with higher scores but whose demographics are adequately represented. The total composite score is a combination of 1/3 GPA, 1/3 SAT I, and 1/3 Review Committee Rating.
  • IMSA had written admissions policies and procedures that were originally approved by the Board of Trustees in 1986 when the Academy opened. Although IMSA’s admissions practices have been modified, the formal policy was not updated and approved by the IMSA Board of Trustees until January 1999. Therefore, IMSA’s actual admissions practices have deviated from Board of Trustees’ approved policy for a number of years.
  • Many key terms used in the current admissions process are not defined in the newly approved policy. In addition, some criteria used during the selection of the second half of the class are not clearly outlined in policy.

REPORT CONCLUSIONS

Illinois Mathematics and Science Academy (IMSA) was created by Public Act 84-126 in 1985. IMSA is a residential school serving 10th – 12th graders. State law states that the primary role of the Academy is to offer a uniquely challenging education for students talented in the areas of mathematics and science. Legislative Audit Commission Resolution Number 115 directed the Auditor General to conduct a management and program audit of IMSA’s admissions process.

IMSA has written admissions policies and procedures and an extensive admissions process which is used to select each 10th grade class. IMSA’s admissions process was originally approved by the Board of Trustees in 1986 when the Academy opened. Since the Academy opened, IMSA’s admissions practices have been modified; however, the formal policy was not updated and approved by the IMSA Board of Trustees until January 1999. Therefore, IMSA’s actual admissions practices have deviated from Board of Trustees’ approved policy for a number of years.

IMSA automatically selects the applicants with the highest total composite scores (which includes applicant’s GPA, SAT I, and Review Committee Rating) to comprise the first half of the admitted class. The second half of the class is selected using additional factors, including geographic, gender, and ethnic criteria.

An IMSA official stated that the ultimate goal of the selection process is to have admissions which approximate the demographics of the State; some IMSA directives also state that as its goal. However, IMSA’s admissions policy directs that admissions reflect the diversity of the applicant pool. IMSA’s applicant pool, mainly in the area of ethnicity, is not representative of statewide demographics.

Many key terms used in the current admissions process are not defined in the newly approved policy. In addition, many of the criteria used during the selection of the second half of the class are not clearly outlined in policy.

A three-year history of IMSA admissions in terms of geographic and gender distributions shows that, while there is some variation, the applicant pool is generally consistent with the statewide distribution of 9th graders and with the invited class. The ethnic distribution has the most variation when compared to the statewide population of 9th graders. Over the three years reviewed, African Americans and Latinos were consistently underrepresented in the applicant pool and in the invited class when compared to the number of African American and Latino 9th graders in the State. Conversely, Asian Americans were consistently overrepresented in both the applicant pool and the invited class when compared to the percent of Asian American 9th graders in the State.

One result of IMSA’s attempt to comply with its statutory requirement to admit a class with adequate geographic, ethnic and gender representation is that applicants with lower total composite scores are admitted to IMSA in the second half of the class over applicants with higher scores but whose demographics are adequately represented. The total composite score is a computed score that is a combination of 1/3 GPA, 1/3 SAT I, and 1/3 Review Committee Rating.

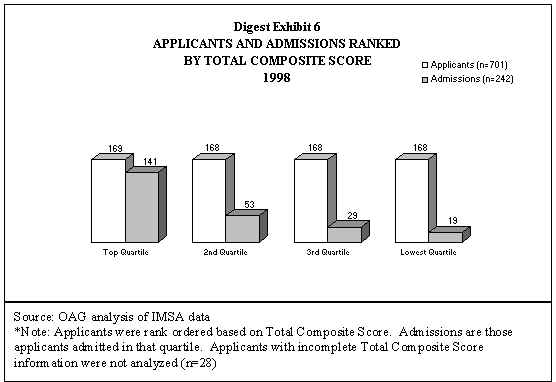
For example, in 1998, 143 applicants in the upper half of the applicant pool based on total composite score were not admitted, whereas 48 applicants in the lower half of the applicant pool were admitted. However, only 4 of the 45 (9 percent) students admitted to IMSA as one of the last 10 based on total composite score in each of the past five years were sent home for academic reasons. Overall, these 45 students’ retention rate was 78 percent compared to IMSA’s retention rate of 88 percent over the past five years.

IMSA has outreach programs to attract qualified candidates interested in the Academy. IMSA conducted outreach programs in all seven of its regions. In 1997/1998, IMSA held informational meetings in 53 locations across the State and offered programs for potential applicants at IMSA and in other cities.

IMSA has targeted some outreach efforts to attract more applicants from underrepresented ethnic groups in the State and should continue outreach efforts in additional areas of the State and towards students who are underrepresented in the applicant pool and invited class.

IMSA does not have any policies or procedures for how many applicants can be admitted from any one particular school nor does its statutory authorization require it. Over the past five years, IMSA has admitted 9th grade students from a total of 403 schools, or 37 percent of the schools in Illinois serving 9th grade students. IMSA also admitted 109 8th graders from an additional 66 schools serving 8th graders.


BACKGROUND

The Legislative Audit Commission adopted Resolution Number 115 on March 2, 1999. The Resolution directed the Auditor General to conduct a management and program audit of the admissions process, outreach programs and admissions history of the Illinois Mathematics and Science Academy.

The primary role of the Academy is to offer a uniquely challenging education for students talented in the areas of mathematics and science.

The Illinois Mathematics and Science Academy was established by Public Act 84-126 in 1985 (105 ILCS 305 et seq.). The Academy opened on September 7, 1986 and graduated its first senior class in 1989. State law states that the primary role of the Academy is to offer a uniquely challenging education for students talented in the areas of mathematics and science.

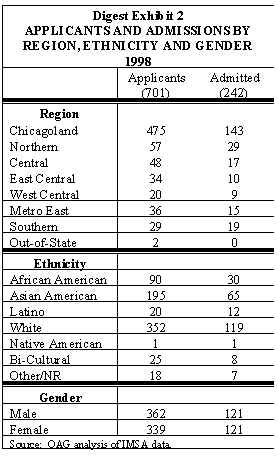
IMSA admits approximately 230 – 240 new students each year into its 10th grade class. The total number of applicants to IMSA has ranged from 645 to 794 over the past three years. Digest Exhibit 1 shows the 7 regions used by IMSA to report admission statistics.

State law states that "The Academy may admit those students who have completed the academic equivalent of the 9th grade and may offer a program of secondary and postsecondary course work. Admission shall be determined by competitive examination." [emphasis added] (105 ILCS 305/2)

IMSA’s Board of Trustees is directed by statute to, among other things:

Establish criteria to be used in determining eligibility of applicants for enrollment. Such criteria shall ensure adequate geographic, sexual and ethnic representation. [emphasis added] (105 ILCS 305/4) (pages 1,4-6)


CLASS SELECTION

In 1998, 701 applicants applied for admission to IMSA. For each applicant, IMSA computes a total composite score. The total composite score is combination of three components equally weighted: SAT I, grade point average (GPA), and Review Committee Rating. The Review Committee Rating is assigned by a Review Committee team who evaluates student essays, math, science and English teacher recommendations and extracurricular activities.


imsadig.gif (11689 bytes)


IMSA policy requires that the first half of the admitted class be comprised of the applicants with the highest total composite scores.

Once total composite scores are computed, then the Selection Committee, comprised of IMSA staff, begins the selection process. IMSA policy requires that the first half of the admitted class be comprised of the applicants with the highest total composite scores. Before the second half of the class is selected, IMSA evaluates the demographic make-up of the first half of the class in terms of ethnicity, geographic location, and gender. IMSA’s policy is to have the admission decisions reflect the demographics of the applicant pool.

The Selection Committee discusses each applicant by region to determine whether to admit or eliminate the applicant. Digest Exhibit 2 summarizes the applicant and admissions data for the 1998 class.

wpe1.jpg (28344 bytes)

The Selection Committee also selects a waitlist of students for possible admission to the Academy. The waitlist is used in the event any of the original class of students do not attend. Exhibit 2-1 in Chapter 2 of the full report outlines IMSA’s admissions process.

The admissions data presented in this report are the students originally invited to the Academy through the selection process. This presentation best measures IMSA’s admissions policy and compliance with its statutory mandate for adequate gender, geographic, and ethnic representation in the class. Some students originally invited to attend may not accept and are replaced with students from the waitlist. We found that the demographics of the final enrolled class were generally consistent with the demographics of the invited class of students. (pages 5-7,10, 12-14, 16-17, 28)

ADEQUACY OF ADMISSIONS POLICY

IMSA’s admissions practices have been modified, however, the formal policy was not updated and approved until January 1999.

IMSA’s original admissions policy was approved by the Board of Trustees in 1986 when the school opened. Over the years, IMSA officials stated that admissions practices have been modified so they could more effectively meet their statutory requirements; however, the formal policy was not updated and approved by the IMSA Board of Trustees until January 1999. Therefore, IMSA’s actual admissions practices have deviated from the Board of Trustees’ approved policy for several years.


Consistency of Admissions Policy with State Law

State law requires that IMSA admissions be determined by competitive examination. IMSA’s policy dictates that the first half of the admitted class be selected by inviting the students with the highest total composite scores (which includes SAT I, GPA, and Review Committee Rating). The selection of the first half is competitive based on these three factors. The selection of the second half of the class is also competitive, although the applicants with the highest total composite scores may not be selected. Given the statutory requirement that admissions should ensure adequate demographic representation, the applicants are evaluated against each other with their demographic attributes taken into consideration.

State law also requires that eligibility criteria established by the Board shall ensure "adequate geographic, sexual and ethnic representation".

The ultimate goal of the selection process is to approximate the demographics of the State, however, IMSA’s policy directs that admissions reflect the diversity of the applicant pool.

An IMSA official stated that the ultimate goal of the selection process is to approximate the demographics of the State. The original IMSA admissions policy noted that a fact sheet regarding the Governor’s Illinois Math and Science Academy Initiative stated "the student population will be selected to approximate the demographics of Illinois."

IMSA’s admissions policy, however, directs that admissions reflect the diversity of the applicant pool. The "Geographic, Gender, and Ethnic Representation" section of IMSA’s admissions policy states that "IMSA will ensure adequate geographic, gender, and ethnic representation in admission decisions by approximating the diversity of the applicant pool" (emphasis added). (pages 9, 16-18)


Clarification of Selection Criteria

The admissions policy could be further clarified regarding the terms and selection criteria used in the admissions process.

While the Board’s admissions policy contains certain selection criteria (such as SAT I and GPA scores) and terms used in the admissions process, the policy could be further clarified regarding other terms and selection criteria. This would help ensure that the actual selection process is consistent with statutory requirements and the Board’s policy.


There are some keys terms used in the selection process which are not defined in IMSA’s admissions policy. For example:

  • While statutes and policy state that IMSA may admit students with the "academic equivalent of 9th grade", IMSA’s admissions policy does not define the core requirements that constitute the academic equivalent of a 9th grader. Such a definition is critical given that IMSA admits 8th grade students.
  • The admissions policy does not describe which qualifying 8th graders will be admitted. In the 1999 applicant pool, IMSA only admitted 8th graders if they were in the first half of IMSA’s admitted class. An IMSA official said this decision was made because 8th grade applicants have the opportunity to apply the next year. Given the importance of the decision not to admit any 8th graders in the second half of the class, IMSA’s admissions policy should specifically address how 8th grade applicants will be handled during the selection process.
The admissions policy could provide minimum guidelines to determine whether students "qualify" for IMSA.


  • The admissions policy could provide minimum guidelines to be used to determine whether students "qualify" for IMSA (such as establishing a minimum SAT I, GPA, Review Committee Rating, or total composite score). This would provide additional guidance to both the Selection Committee and applicants, as well as help ensure that the students being admitted to IMSA meet the Board’s understanding of "qualified."
  • IMSA uses "goals" to monitor its progress towards geographic, gender and ethnic representation required in statutes. These goals represent the number of students needed in the invited class to approximate the demographics of the applicant pool. The process of establishing or implementing goals is also not addressed in the admissions policy.

Some Selection Criteria or Factors Not Addressed in Policy

Some criteria or factors not in IMSA’s admissions policy were considered in the selection process.

We noted in our observation of the 1999 selection process there were criteria or factors not in IMSA’s admissions policy that were considered in the selection process. These factors included: the math and science opportunities at the applicant’s current school; his or her class rank; and whether there were contributing factors that may account for a low GPA or SAT I verbal score. These factors were used by the Selection Committee to determine whether to admit an applicant.

Digest Exhibit 3 lists criteria contained in IMSA’s admissions policy for the selection of the second half of the class. The policy does not prioritize criteria used in the selection of the second half of the class. Since this portion of the process is more subjective, IMSA should more clearly state the relative importance of these criteria.

Digest Exhibit 3

IMSA POLICY – STUDENT SELECTION

"In order to ensure adequate geographic, gender, and ethnic representation, in selecting the second half of the class the Selection Committee considers the applicants’ rankings, the demographics of the selected class thus far, the demographics of the applicant pool, the demographics of the State of Illinois, and the strengths of the individual applicants."

Source: IMSA Admissions Policy

We recommended that IMSA’s Board of Trustees periodically review and update the admissions policy, define all pertinent terms and criteria used in the selection process in the policy, and consider prioritizing the criteria being used in the selection of the second half of the class. (pages 19-22)

IMSA SELECTION AND ENROLLMENT HISTORY

The geographic distribution of the applicant pool is fairly consistent with the statewide distribution of 9th graders and the admitted class.

The audit resolution asks us to determine whether a historic review of IMSA admissions indicates gender, ethnic, and geographic representations commensurate with the ninth grade student demographics in each of the seven regions.

Digest Exhibit 4 shows that in terms of geographic distribution, the applicant pool is fairly consistent with the statewide distribution of 9th graders and the admitted class. Some of the largest variations occur in the Chicagoland area where in each of the last three years the percentage of students admitted was less than both the statewide and applicant pool. Conversely, the

Digest Exhibit 4

GEOGRAPHIC DISTRIBUTION OF IMSA APPLICANTS

1996-1998

Region*

1996

1997

1998


State

Pool

Admit

State

Pool

Admit

State

Pool

Admit

Chicagoland

63.0%

68.6%

58.7%

62.6%

69.0%

61.7%

62.9%

67.8%

59.1%

Northern

9.4%

9.2%

13.2%

9.4%

8.2%

9.6%

9.5%

8.1%

12.0%

Central

9.7%

7.1%

12.3%

9.6%

7.3%

10.4%

9.6%

6.8%

7.0%

East Central

4.2%

4.8%

4.3%

4.2%

2.6%

3.3%

4.2%

4.9%

4.1%

West Central

3.3%

3.1%

3.4%

3.3%

3.6%

3.3%

3.2%

2.9%

3.7%

Metro East

4.7%

3.4%

3.4%

5.0%

5.3%

5.4%

4.8%

5.1%

6.2%

Southern

5.7%

3.8%

4.7%

5.8%

4.0%

6.3%

5.8%

4.1%

7.9%

Out of State

N/A

0%

0%

N/A

0%

0%

N/A

<1%

0%

Notes: * The county composition of each region is shown on page 5 in Chapter 1.

State = Percent of statewide 9th graders from each IMSA region.

Pool = Percent of IMSA applicant pool from each region.

Admit = Percent of students IMSA invited for admission from each region.

Source: OAG analysis of IMSA and SBE data.


percentage of students from the Northern region admitted to the Academy was higher than their statewide and pool representations for all three years.

The ethnic distribution, presented in Digest Exhibit 5, had the most variation when comparing the statewide population of 9th graders to the applicant pool and admitted class. Over the three years reviewed, Asian Americans were consistently overrepresented in both the applicant pool and the admitted class, when compared to the percent of Asian American 9th graders in the State. Asian Americans have consistently comprised approximately 3 percent of the statewide population of 9th graders but comprised 25 percent to 31 percent of the applicant pool and the admitted class.

Digest Exhibit 5
ETHNIC DISTRIBUTION OF IMSA APPLICANTS
1996-1998

Ethnic Group

1996

1997

1998


State

Pool

Admit

State

Pool

Admit

State

Pool

Admit

African American

22.5%

8.6%

10.6%

22.4%

11.5%

10.0%

22.0%

12.8%

12.4%

Asian Americans

3.1%

30.2%

26.8%

3.1%

31.2%

25.0%

3.0%

27.8%

26.9%

Latino

12.0%

4.3%

5.5%

12.7%

4.3%

7.1%

12.9%

2.9%

5.0%

White

62.2%

54.2%

53.2%

61.7%

47.0%

51.3%

61.9%

50.2%

49.2%

Native American

<1.0%

<1.0%

0.0%

<1.0%

<1.0%

<1.0%

<1.0%

<1.0%

<1.0%

Bi-Cultural1

0.0%

0.0%

0.0%

0.0%

3.1%

4.6%

0.0%

3.6%

3.3%

Other/NR

0.0%

2.6%

3.8%

0.0%

2.8%

1.7%

0.0%

2.6%

2.9%

Note: Numbers may not add to 100 percent due to rounding.
1 SBE does not report a bi-cultural classification; IMSA began using the bi-cultural classification in 1997
State = percent of statewide 9th graders from each ethnicity.
Pool = percent of IMSA applicants from each ethnicity.
Admit = percent of students IMSA invited for admission from each ethnicity.
Source: OAG analysis of IMSA and SBE data


Conversely, other ethnic groups have been underrepresented in the applicant pool and the admitted class, compared to statewide demographics. For example, African Americans have consistently comprised approximately 22 percent of the statewide population of the 9th graders. However, they have only comprised between 8 percent and 13 percent of the applicant pool and admitted class. Similarly, Latinos have comprised approximately 3 percent to 4 percent of the applicant pool and 5 percent to 7 percent of the admitted classes in the past three years as compared to 12 percent to 13 percent representation in the State.

In terms of gender distribution, there is almost an even split between male and females in the statewide population, the applicant pool, and the admitted class. (pages 1, 28-31)


One result of admitting a class with adequate representation is that students with lower total composite scores are admitted over students with higher scores in the second half of the class.

Score Distributions for IMSA Applicants and Admissions

One result of IMSA’s attempt to comply with its statutory requirement to admit a class with adequate geographic, ethnic and gender representation is that qualified applicants with lower total composite scores, but who meet one of IMSA’s demographic goals, are admitted to IMSA in the second half of the class over applicants with higher scores but whose demographics are adequately represented.


wpe1.jpg (25622 bytes)


In 1998, 143 applicants in the upper half of the applicant pool based on total composite score were not admitted, whereas 48 applicants in the lower half were admitted.

Digest Exhibit 6 shows the applicant pool and the invited students in categories based on their total composite scores. The total composite score is a computed score that is a combination of 1/3 GPA, 1/3 SAT I and 1/3 Review Committee Rating. In 1998, 143 applicants in the upper half of the applicant pool based on total composite score were not admitted,

whereas 48 applicants in the lower half of the applicant pool based on total composite score were admitted.

To determine how successful enrolled students with lower total composite scores were at the Academy, we requested the status of the 10 applicants with the lowest total composite scores invited to the Academy in each of the past 5 years. Of the 50 students, 5 declined IMSA’s invitation. Of the

remaining 45, 78 percent (35 of 45) have either graduated or are still attending, 9 percent (4 of 45) withdrew for academic reasons, 7 percent (3 of 45) were sent home for disciplinary reasons, and 7 percent (3 of 45) voluntarily left IMSA. The 78 percent retention rate is lower than IMSA’s average overall retention rate of 88 percent over the past five years. (pages 27, 33-35)

IMSA OUTREACH

One purpose of IMSA’s outreach is to create interest and awareness in the Academy and to have qualified students who are representative of the statewide demographics apply to the Academy.

One purpose of IMSA’s outreach effort is to create interest and awareness in the Academy and to have qualified students who are representative of the statewide demographics apply to the Academy. IMSA has both general and targeted outreach programs to attract qualified candidates interested in the Academy. IMSA conducted general outreach programs in all seven of its regions. Informational meetings were held in 53 locations across the State. IMSA’s outreach efforts are advertised in newspapers to inform potential participants of the programs available or how to find out more about the Academy. IMSA also conducts a mass mailing of applications to approximately 2,900 public and private schools serving 8th and 9th grade students in the State.


IMSA’s targeted outreach efforts attempt to attract more applicants from underrepresented ethnic groups in the State. Many programs are conducted in the Chicagoland and Metro-East regions. For example IMSA’s Early Involvement Program serves minority and economically disadvantaged students and is a Saturday academic program designed to enhance learning, motivation, and study skills.

We recommended that IMSA consider expanding its outreach efforts in regions where significant underrepresented populations are located. (pages 37-41, 45)


IMSA is not required to have, and does not have, any policy or guidelines for the number of applicants who can be admitted from any particular school.

HISTORY OF ADMISSIONS BY SCHOOL

The audit resolution asked us to determine if IMSA has established and implemented procedures to ensure that enrolled students are not consistently selected from specific schools in each of their seven regions.

IMSA is not required to have, and does not have, any policy or guidelines for the number of applicants who can be admitted from any particular school. In the past five years, IMSA has admitted students from 37 percent (403 of 1,094) of Illinois schools serving 9th graders in 1998. IMSA also admitted 109 8th graders from an additional 66 schools serving 8th graders.

We noted there were areas of the State where additional targeted outreach by IMSA may be desirable. We recommended that IMSA consider conducting analyses of schools with few applicants and admissions in past years to ensure that current outreach efforts are reaching all potential IMSA applicants. (pages 1, 41, 44-45)

RECOMMENDATIONS

The audit had two recommendations to which IMSA generally agreed. IMSA’s responses are included after each recommendation and complete written responses are included in Appendix D of the Audit Report.

_________________________

WILLIAM G. HOLLAND

Auditor General

WGH\KM